New Nature study lays out standard to measure how our brains grow
Scientists can one day have a standard way of charting the way our brains grow over time, according to a new study published in the journal Nature today.
Just the same way a child’s height and weight is measured by a physician each year to check how they’re maturing, the study, led by Cambridge University and the Children’s Hospital of Philadelphia researchers, is establishing a standard chart for seeing how our brains are changing as we grow.
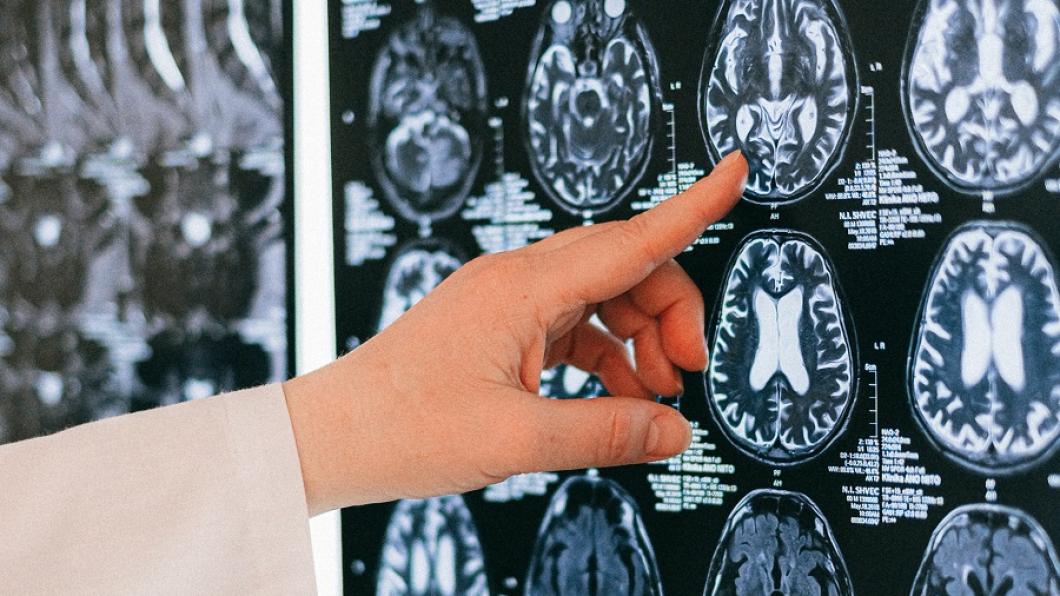
The researchers collated data from 123,984 MRI brain scans of 101,457 individuals aged between 115 days after conception and 100 years old, from over 100 studies worldwide – including those from the POND Network (Province of Ontario Neurodevelopmental Network). The team created charts of typical brain development across a lifetime, which could be used to generate 'centile scores' to determine whether an individual is on a standard trajectory. These charts — which were separated according to sex — were stable in their predictions, despite study-specific differences in both the individuals assessed and the techniques and methods used. Critical developmental periods — such as an approximate 70% increase in the size of the brain between the time before 17 weeks after conception and 3 years of age — were revealed. The standard framework also enabled the detection of patterns of changes in brain anatomy associated with atypicality, disorders or disease; for example, predictions of a transition from a diagnosis of mild cognitive impairment to that of Alzheimer's disease.
Dr. Evdokia Anagnostou, a child neurologist with Holland Bloorview Kids Rehabilitation Hospital and one of the study’s Canadian co-authors, says these charts can have potential future applications in the digital assessment of brain health and disorders diagnosed at any age.
“When we look at body growth, height and weight, we know what’s expected at particular ages, and we can determine if a child or youth is growing as expected, or if there are any concerns,” says Dr. Anagnostou, who is also a co-lead of the hospital’s Autism Research Centre and assistant director of the Bloorview Research Institute. “Without having standards about what the range of expected brain growth and organization is, we can’t look for differences that may be associated with distress or impairment.”
Dr. Anagnostou adds, in the absence of standards, that researchers tend to recruit small numbers of typically developing participants so that their brains can be scanned using MRIs to help scientists’ compare their brains to those who experience neurodevelopmental differences. But she points out that brains are all different, so ‘there is a bias that is introduced when a small number of brains is used to produce the expected range from the entire population and across the lifespan.’
“Once we know what typically developing brains looks like and factor in variables not associated with disorders, or conditions that can produce distress or impairment, we can then develop ways to detect differences that can be a marker for neurodevelopmental or other neurological conditions,” says Dr. Anagnostou.
The authors emphasise that substantial, future research will be needed before these results can be put into clinical practice. Caveats, such as potential data bias towards European and North American populations and individuals of European ancestry within these groups, will also need to be addressed. However, by providing these charts in an interactive, open-access format, they anticipate that the database will continue to evolve.